
Prometheus
Runs up to six Prometheus queries you write and shows their current values.
Set it up
Section titled “Set it up”Sign-in: None.
integrations:  prometheus-metric:    type: prometheus-metric    url: http://prometheus-metric:8080    metrics:      - label: Requests        query: sum(rate(http_requests_total[5m]))        unit: /s      - label: Disk free        query: node_filesystem_free_bytes{mountpoint="/"}        format: bytes      - label: Scalar        query: scalar(up)
layout: - title: Infrastructure widgets: - prometheus-metric.status| Option | Type | Default | What it does |
|---|---|---|---|
url | URL | required | Where the service answers, from Valet’s side. |
href | string | optional | Where the card links to, when that differs from url. |
every | string or number | optional | How often to refresh while someone is looking: seconds, or 30s, 5m, 1h. |
insecure | boolean | optional | Accept a self-signed certificate for this service only. |
metrics | list of object | required | Up to six queries. |
metrics[].label | string | required | The number’s name. |
metrics[].query | string | required | The PromQL query. |
metrics[].format | number, bytes, rate, duration, ratio | optional | How to write the result. |
metrics[].unit | string | optional | Written after the value. |
Widgets
Section titled “Widgets”One widget. Its key is prometheus-metric.status, using the instance name from your config.
Prometheus
Section titled “Prometheus”prometheus-metric.status · stats card · refreshes every minute while the page is open.
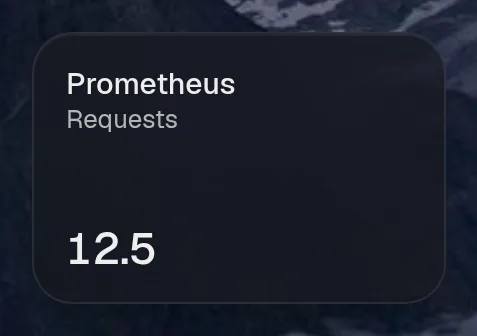

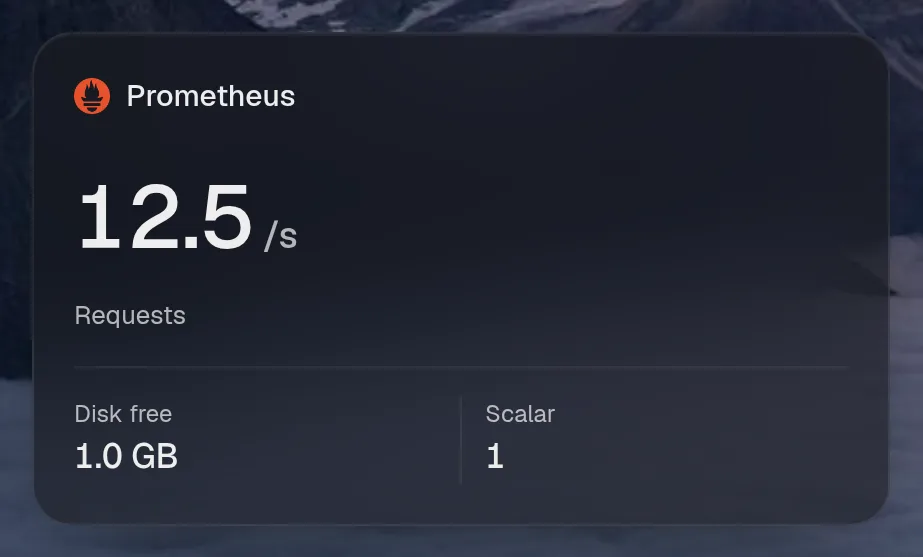

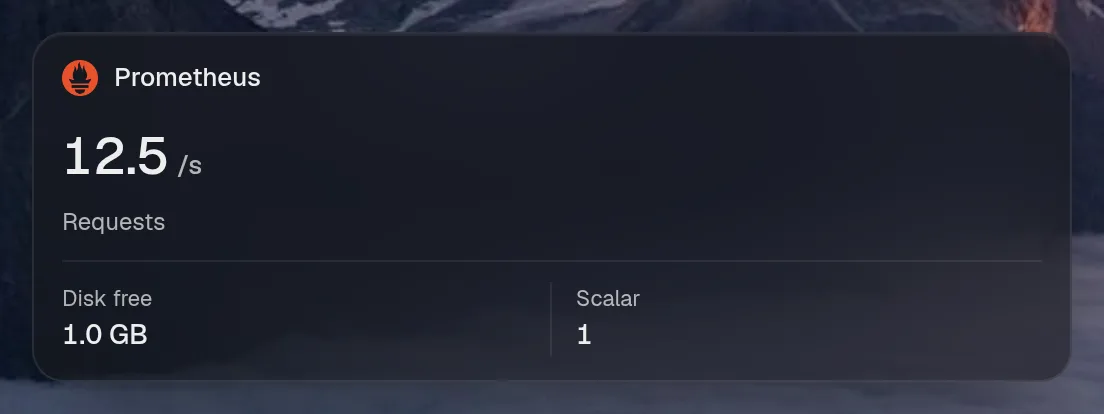
Tall draws the same as medium, so it isn't shown. Only the empty space changes.
States
Section titled “States”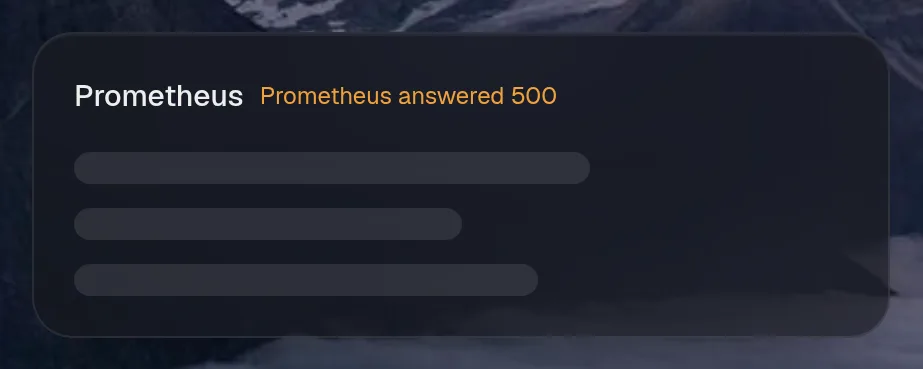
Assistant tools
Section titled “Assistant tools”What the assistant can use, once its access level allows it. Read tools run freely. Everything else asks first.
| Tool | Access | What it does |
|---|---|---|
prometheus_metric_status | read | Reads the Prometheus queries set in the config and shows their current values. |