
Tiles and rings
Any card can carry a summary, or several in summaries. That’s what the small and wide sizes show, and what the tiles and rings section displays and the menubar use. Integrations write a good summary; the layout chooses how it’s shown.
Variations
Section titled “Variations”tile · marks
Section titled “tile · marks”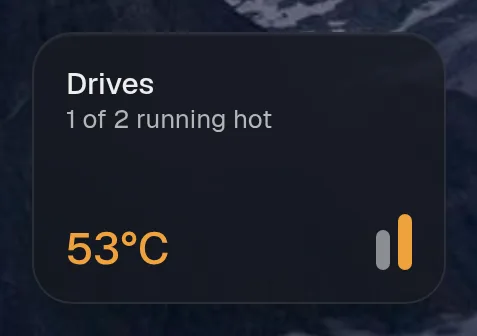
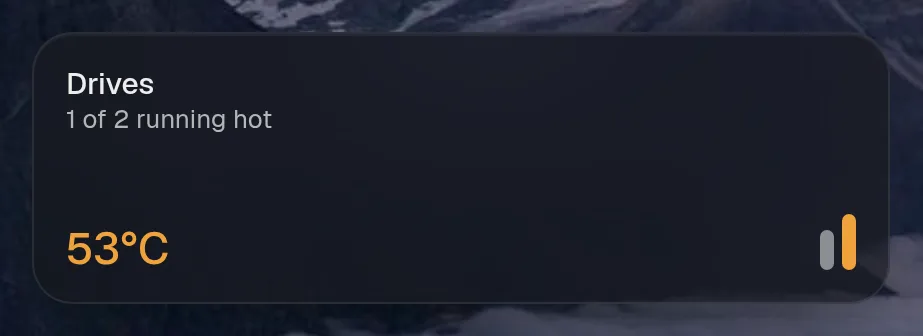
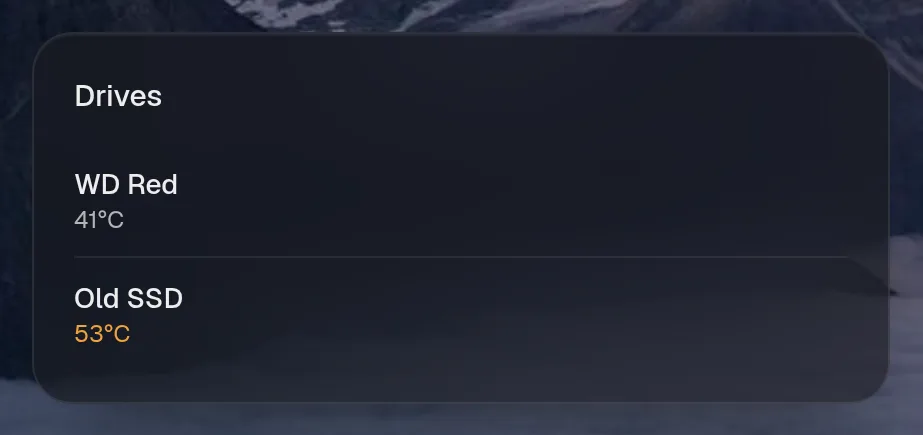
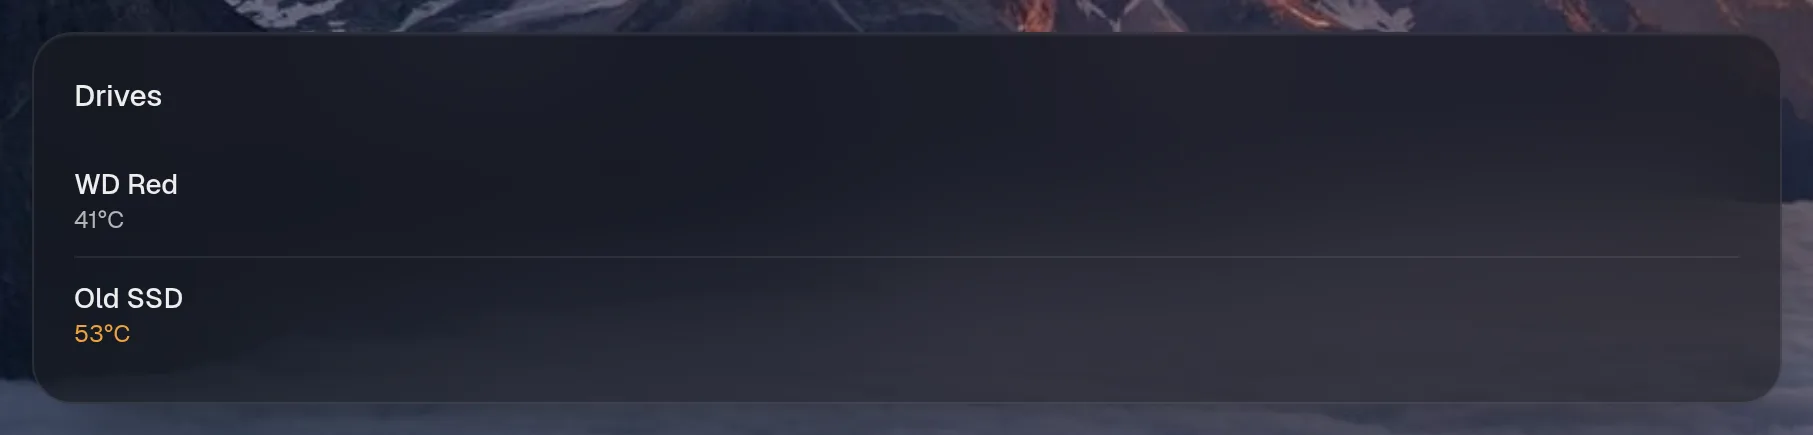
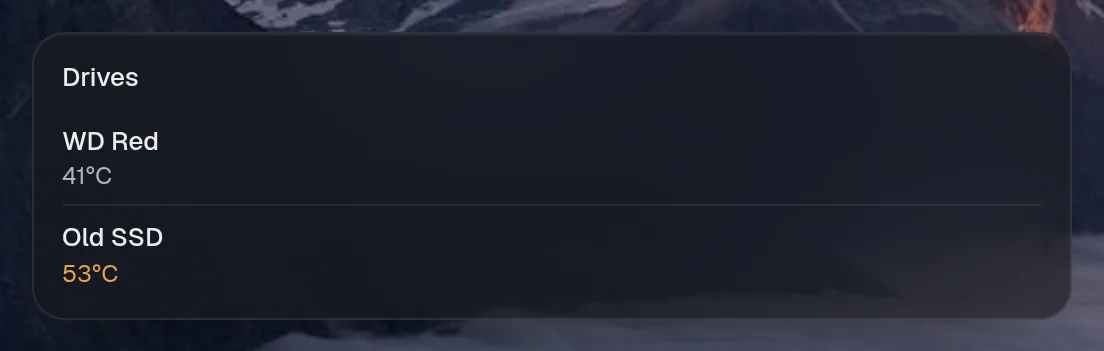
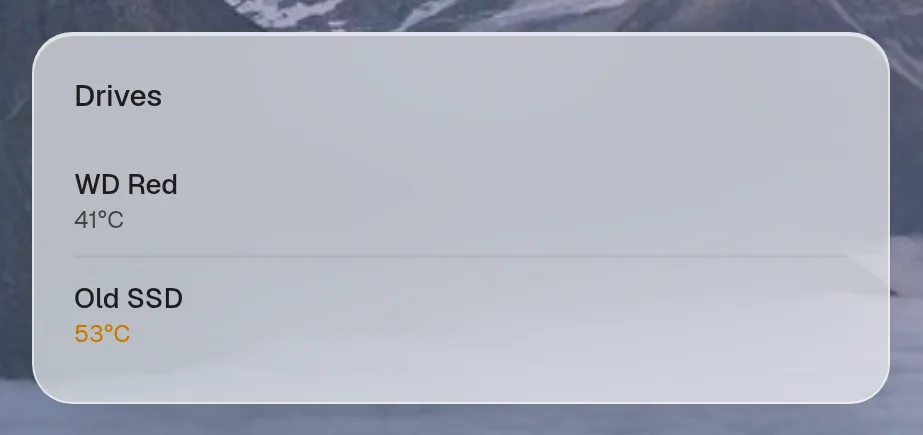
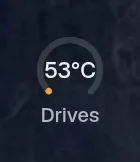
Tall draws the same as medium, so it isn't shown. Only the empty space changes.
tile · artwork
Section titled “tile · artwork”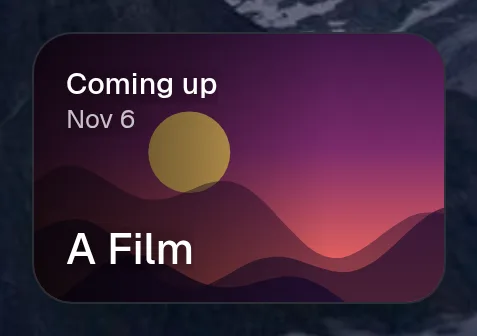
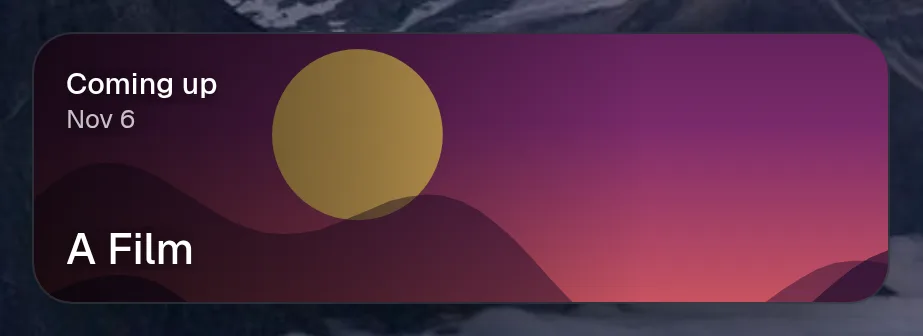

Tall draws the same as medium, so it isn't shown. Only the empty space changes.
Fields
Section titled “Fields”| Field | Type | What it does |
|---|---|---|
label | string | |
value | string | number | |
sub? | string | under the label, e.g. “Ryzen 9” |
detail? | string | bottom right, e.g. “39°C” |
tone? | Tone | |
icon? | string | |
trend? | number[] | recent values, drawn as a live area graph behind the tile |
color? | string | that graph’s colour |
pct? | number | 0..1, for ring gauges |
ring? | string | the number shown inside a ring gauge, if different from value (e.g. “23%”) |
image? | string | artwork that fills the tile, with the text over it |
marks? | Mark[] | one small bar per thing the tile counts, e.g. a bar for each drive |
waffle? | boolean | draw pct as ten rows of ten squares: “14 in every 100” where a share is the whole story |
every? | number | ms between trend points, so the graph can say when each one was |
One thing in a tile’s row of bars: pct sets the height, tone the colour, label the tooltip.
| Field | Type | What it does |
|---|---|---|
pct? | number | |
tone? | Tone | |
label? | string |